December 25, 2007

How much you know your Boilers or Steam Generation System?

I am starting this open discussion for the benefit of all the readers / visitors of this site. Many students & even process engineers do not fully understand the concept of efficiency calculation methods especially for steam system and in particular steam generation system.

So let me ask you One simple question.....Will the boiler efficiency increase if I increase combustion air temperature?

If your answer is Yes then probably you need to read & discuss the entire issue again.

If your answer is No then again you need to define the terms & explain them.

So I am not putting much here now...as I am leaving it open ended for discussions among all of you...........& will come back later on this topic.

Get Free Updates:
*Please click on the confirmation link sent in your Spam folder of Email*

Continue to read this post...

December 21, 2007

Turbines for Saturated Steam??? - More Energy - More Savings

Traditionally, the cogeneration of steam and electricity has been restricted to plants that generate superheated steam, making the recovery of energy losses from saturated steam impossible for many industrial sites ranging from distilleries to pharmaceutical plants and pulp-and-paper mills.

Pennat International Corp promised to change that with the introduction of its new Energy Conversion System (ECS) Series of saturated steam turbines.


Yes Steam turbines which operate with saturated steam as motive fluid.

The turbines, which can also function with superheated steam, generate incidental electrical power while regulating and maintaining steam pressure like a conventional pressure-reduction station. They are intended to be installed in parallel with the existing pressure-reducing valve (See Diagram below) or pressure-reducing desuperheater station and process-control software tasked with managing the pressure consistency of reduced-pressure process streams.

With steam typically produced at significantly higher temperatures and pressures than needed for its intended process application, the turbines promise greater resource efficiency, reduced energy consumption and associated environmental benefits.

For the past eight years, Pennant has installed specially commissioned versions of its saturated-steam turbines for facilities in India, Dubai and elsewhere. The costs of system and installation vary based on steam throughput, but can be around $400,000for a 77,000-lb/h saturated steam flow and $250,000 for a 22,000-lb/h flow.


However, with power savings of $325,000/ yr and $135,000/yr, respectively, Pennant estimates payback periods of less than two years (assuming in both cases an operation time of 8,000 h/yr and an energy cost of 6.33 ¢/kWh). The ECS Series is a slightly more modular concept based on the needs of the typical industries that would use them and function within a pressure range of 50–700 psi. Units will be ready to ship within months.

Get Free Updates:
*Please click on the confirmation link sent in your Spam folder of Email*

Continue to read this post...

December 15, 2007

HVAC - Quick Calculation of refrigeration load for Rooms

A building or room gains heat from many sources. Inside occupants, computers, copiers, machinery, and lighting all produce heat. Warm air from outside enters through open doors and windows, or as ‘leakage’ though the structure. However the biggest source of heat is solar radiation from the sun, beating down on the roof and walls, and pouring through the windows, heating internal surfaces.

The sum of all these heat sources is know as the heat gain (or heat load) of the building, and is expressed either in BTU (British Thermal Units) or kW (Kilowatts).

For an air conditioner to cool a room or building its output must be greater than the heat gain. It is important before purchasing an air conditioner that a heat load calculation is performed to ensure it is big enough for the intended application.


Quick calculation for offices
For offices with average insulation and lighting, 2/3 occupants and 3/4 personal computers and a photocopier, the following calculations will suffice:

Heat load (BTU) = Length (ft.) x Width (ft.) x Height (ft.) x 4

Heat load (BTU) = Length (m) x Width (m) x Height (m) x 141

For every additional occupant add 500 BTU.

If there are any additional significant sources of heat, for instance floor to ceiling south facing windows, or equipment that produces lots of heat, the above method will underestimate the heat load. In which case the following method should be used instead.

A more accurate heat load calculation for any type of room or building

The heat gain of a room or building depends on:

  1. The size of the area being cooled.

  2. Sze and position of windows, and whether they have shading./li>
  3. number of occupants.

  4. generated by equipment and machinery.

  5. generated by lighting .


By calculating the heat gain from each individual item and adding them together, an accurate heat load figure can be determined.

Step One

Calculate the area in square feet of the space to be cooled, and multiply by 31.25

Area BTU = length (ft.) x width (ft.) x 31.25

Step Two

Calculate the heat gain through the windows. If the windows don’t have shading multiply the result by 1.4.

North window BTU = Area of North facing windows (m. sq.) x 164

If no shading, North window BTU = North window BTU x 1.4

South window BTU = Area of South facing windows (m. sq.) x 868

If no shading, South window BTU = South window BTU x 1.4
Add the results together.

Total window BTU = North window + South window

Step Three
Calculate the heat generated by occupants, allow 600 BTU per person.

Occupant BTU = number of people x 600

Step Four

Calculate the heat generated by each item of machinery - copiers, computers, ovens etc. Find the power in watts for each item, add them together and multiply by 3.4

Equipment BTU = total equipment watts x 3.4

Step Five

Calculate the heat generated by lighting. Find the total wattage for all lighting and multiply by 4.25


Lighting BTU = total lighting watts x 4.25

Step Six
Add the above together to find the total heat load.

Total heat load BTU = Area BTU + Total Window BTU + Occupant BTU + Equipment BTU + Lighting BTU

Step Seven

Divide the heat load by the cooling capacity of the air conditioning unit in BTU, to determine how many air conditioners are needed.

Number of a/c units required = Total heat load BTU / Cooling capacity BTU

You can download a demo version of HVAC calculation software here.
Download ComfortAir HVAC Software

Get Free Updates:
*Please click on the confirmation link sent in your Spam folder of Email*

Continue to read this post...

December 08, 2007

Never Ignore Pump Bypasses?

Many of you, especially who are handling projects engineering, may be surprised when & why should I consider bypass for pumps. What is the utility for considering bypasses? Why not only relief valves are sufficient for safeguard against high pressure in the line? The list may be little longer than my expectation…. Here are few things to remember….

Here is the list of few important considerations for Bypasses.
  1. For all Positive displacement type pumps (PD pumps) full size bypasses are always essential in the form of safety relief valves back to the suction line or suction tank.

  2. All the equipments or instruments before the bypasses in item-1 above should be designed up to 1.5 times of the set value of relief valve.

  3. To prevent excessive temperature rise at prolonged low flow operation compared to design value, a bypass is necessary for

    a. High discharge head pumps due to higher rate of temperature rise at low flow and,

    b. Liquids operating near saturation temperature. Normally, BFW (boiler feed water) pumps are equipped with automatic regulators for bypass flow due to availability of both these factors in one pump.

    c. Usually 10% of normal flow is sufficient in such cases as bypass flow.

  4. To avoid unstable operation below certain point in case of some pumps it is necessary to provide bypass. This condition arises out due to internal re-circulation which may result in vortex cavitations, low frequency pulsation and, vibrations. This normally occurs if Ns (Suction specific speed) is very high at 10000 or more.

  5. Automatic bypass is necessary for pumps, which are controlling level or temperature instead of flow. In such cases variations are usually large & prolonged and it may have to run at shut-off also due to process disturbances or during start-up / shutdown.

Get Free Updates:
*Please click on the confirmation link sent in your Spam folder of Email*

Continue to read this post...

December 05, 2007

How to Calculate Viscosity of Liquid Mixture?

Have you ever faced a problem of calculating the Viscosity of a Muixture?
Most of us feel that there is no approx formula for calculating Viscosity of mixture of liquids.

Now here is a useful co-relation. Thanks to Milt, It is his effort which can be very useful for many of us.


Calculating the viscosity of a blended liquid consisting of two or more liquids having different viscosities is a three step procedure. The first step involves calculation of the Viscosity Blending Index (VBI) of each component of the blend using the following equation (known as a Refutas equation):

(1) VBI = 14.534 × ln[ln(v + 0.8)] + 10.975

where v is the viscosity in centistokes and ln is the natural logarithm (Loge).

The second step involves using this blending equation:

(2) VBI-blend = [wA × VBIA] + [wB × VBIB] + ... + [wX × VBIX]

where w is the weight fraction (i.e., % ÷ 100) of each component of the blend. In using the above blending equation, it is necessary that all viscosities are determined at the same temperature, for example, 100 °C.

The third and final step is to determine the viscosity of the blend by using the invert of equation (1):

(3) v = (ee(VBI - 10.975) ÷ 14.534) − 0.8

where VBI is the Viscosity Blending Index of the blend and e is the transcendental number 2.71828, also known as Euler's number.

Get Free Updates:
*Please click on the confirmation link sent in your Spam folder of Email*

Continue to read this post...

November 23, 2007

Understanding Compressors Curves

Compressor Curves are generally misunderstood in day-today working of process engineers and many confusions arises out of discussion among cross functional teams. This becomes more confusing in case of Recycle loop systems for example in Ammonia synthesis loop OR Ethylene oxide Synthesis Loop. In view of this, I decided to write this article based on my recent experience.


In case of Compressors, first thing is to understand the Head Vs Flow Curve. Please do not get confused between Head and discharge pressure which are significantly different than pumps where usually fluid specific gravity is around 1.0.

Now Let us first note down the requirement, as below

  1. Curve Readings - Head & Flow from Design Curve.
  2. Speed at Which the Curve is applicable.
  3. Design Suction P & T.
  4. Design Molecular Weight of the Gas
These are the minimum requirements to simulate your compressor for any modification study.

Now if you need to consider any speed change it can be (As shown in attached file), otherwise new operating conditions can be specified. So the first step is to consider the new flow & head curve based on revised speed.

Then the program in attached sheet calculates actual suction volume at design conditions and then calculates developed head at new speed at specified flow. This head can be converted to new conditions in terms of discharge pressure.

Or if desired head is given new flow can be calculated by iterations from the given curve at revised speed.

In this way when we convert actual condition to design basis and consider converted suction volume the original curve is still applicable. This helps in avoiding any confusion due to change in suction condition in actual plant operation compared to design. The fundamental is simple - if you convert gas volume at design condition that will be understood by the compressor as if it is operating on the curve.

OR if compressor handles Actual M3 of flow at design condition then the developed head point will lie on the original curve or revised curve if speed is changed.

The assumptions in this sheet are
  1. No speed change beyond 10% of design value because errors are larger due to change in internal flow pattern.
  2. No change in efficiency. Though I have considered efficiency correction factor if you wish to apply it manually.
  3. No thermodynamic calculation of discharge temperature is done.
If you have any query related to any compressor problem kindly let me know. I have also developed a BC++ program for any high pressure real gas mixture compression system which uses equation of states for the calculation of thermodynamic properties of the gaseous mixture and its efficiency, which is tested for highly non ideal system also upto 220 bar pressure.

To Download the file , just click .... Compressor Evaluation

No of Downloads:-

Readymade pack is available for Hydrogen, Air, Nitrogen, Oxygen, Synthesis Gas of Ammonia plant, Recycle gas for EO plant, CO2. For any other gaseous mixture it can be easily modified.

Get Free Updates:
*Please click on the confirmation link sent in your Spam folder of Email*

Continue to read this post...

November 08, 2007

Oil Tanks - Tonnage Measurement - New Cost Effective Method

Recently Zaki had posted a write up on his blog related to this issue, whereas I commented about inaccuracy of this method & my experience. I had been doing it in my earlier days but I was never satisfied with the results due to large inaccuracies. So I thought to share it with you which will help you in taking care of these aspects.

One may not think or consider an inaccuracy of 0.5-2.5 % seriously but the view can be made clear from a simple example in case of tanker of etiher diesel or fuel oil. The tankers usually do not have more than 2 meter in height. If you dip tape & measure where an error of <1">) than you have an error of 0.5% (10mm / 2000mm which is tank height)to 1.2%.

The Method
In the conventional method a metallic dip tape is dipped from the top of the tanker or storage system, which goes in due to its weight and thus we measure the level.

The Problem
The problem arises due to three factors i.e. Density of Oil, Viscosity of Oil & Surface Tension (to some extent). As said, tape goes inside due to its weight so a buoyancy force also act on it which increases its floating nature.

Secondly due to viscosity & floating tendency (as described above) the tape goes inclined or slacks inside the tank. This goes unnoticed due to invisibility.

The Impact
The impact of this can be realized as below (Tanker example is already given above), Now we will consider an storage tank of ~5000 KL which is an usual size for FO storage & an usual height shall be ~10-15 meters. So let us consider 12 meter as general average height. If you go & measure the level in the tank which shall be somewhere ~70% of the total height than total H becomes ~8500 mm. Now in this case slack may go upto 2" (inches) which comes ~0.7%. practically it goes to as high as 1.5% however if I consider only 0.5% error than can you imagine the impact?

The impact come from your usage e.g. in a fertilizer plant the average daily consumption goes ~200-250 KL / day. Now 0.5% of it become ~1 KL / day. This will soon result in your inevntory error with in a month (30 KL difference) which is practically two tanker loads. So you might land up in great errors.

The Solution
There are two ways to solve this problem in practical life.
  1. Use some standard level gauge measurement system.

  2. There are many devices claimed to be accurate but the question is how much they are accuarte & what is the cost of accuracy you are paying for?

    Automatic gauging is the term coined for this solution but let us look at practical example & its cost.

    Equipment Cost / Tank - $3100 Average
    Installation - $500
    Monitor - $2200
    Cables etc. - $1600

    Minimum Total Cost - $7400 / Tank

    Accuracy Claimed - 0.1%
    Actually achieved - 0.3 - 0.5%
    RESULT - Practically no Gain, system remains same only adjustment frequency is changed.


  3. Use a simple manual method as described below.

  4. Based on my experience this is the best method so far I have found & is practically very low cost, in fact only ~1500$/year. Just install a simple tube of any transparent material if it is flexible than good, otherwise also, no problem e.g. Plastic tube or glass tube.

    Connect it to the bottom of the tank at any drain point or spare point. It doesn't matter where this bottom point is as long as your expected liquid level is above this point. Now there are two possibilities - 1. if you are using flexible tube & 2. If you are using straight (non flexible) tube.

    In case of flexible tube after connecting it to the bottom point (Drain should be closed) take it up to the expected level height manually. Open the bottom drain slowly & hold the tube from the maximum level; oil has risen in it. Touch it to the tank wall & straight the flexible tube portion in your reach on the tank wall. See if any drop or rise is there in the tube. Hold it straight on the wall of the tank & mark the level in the tube on tank wall using a pencil. This is your most accurate level point in the tank.

    In case of straight / nonflexible tube, it can be connected at the bottom of the same drain & top of the tube can be connected to the vapor space with a isolation valve so that vapor lock can be released whenever level is measured. It will look like a level gauge tube.

    However the disadvantage of this method is that it is not recommendable for volatile liquids e.g. Naphtha etc. rather they are not installed on big size tanks to avoid any mishap during leakages. So don't forget to install extra isolation valves on extended metal pipes required for connecting this tube. This will help in complete isolationof tube from tanks.

The Gain
In this case the error will not be more than 2-3 mm (Or say Max 5 mm) if done properly which will result in 0.05% max error. This will cause an error of 0.1 KL/Day for the same example of fertilizer plant. So the same error will occur after a year instead of a month.

Also it is very inexpensive compared to ~$7000 investment /tank but you need a person to do it which will cost ~$1500 / Year (Labour cost).

If you have nay question kindly let me know on the forum or on the comments section of this post.

Get Free Updates:
*Please click on the confirmation link sent in your Spam folder of Email*

Continue to read this post...

November 02, 2007

Site Updates

This post is a part of an ongoing updates on this site to keep you aware about developments & future planning.

I am adding DOWNLOADS section, which will provide useful downloads for all of you. Kindly feel free to browse it here OR select it from tab listed at the top of this page. You will find only those which I have used and found them useful for all.

Next I have removed Stores page, which shall be modified & relaunched by next month or so.

Next based on site stats I am finding that many of my readers are searching for cooling tower related queries. So I would request them to post their any kind of query related to Cooling Towers on my FORUM & I will answer them one by one including evaluations of performance, tower capacity related questions or anything else.

I am also including one GuestBook on downloads page & request readers to leave their feedback so that I can further improve this site.


Get Free Updates:
*Please click on the confirmation link sent in your Spam folder of Email*

Continue to read this post...

October 31, 2007

Process Engineers - Real Challenges Or Mistakes

Many forums or dicussion board / Blogs will tell you about the role of process engineers in the chemical manufacturing industry. But you may rarely find out the real technical challenges faced by a process engineer. Recently I faced some of them & then thought to write on this issue.

The most important out of several ones is the availability of CORRECT DATA.


The role of process engineer includes the following:
  1. Process Scheme Development using technical improvement measures.
  2. Process Improvement using technological developemnts.
  3. Process Troubleshooting.
  4. Productivity & Efficiency Improvements.
  5. Energy Conservation & Management activities.
  6. Technology Transfer etc.

Therefore, you need to search lot of data required for your analysis. Out of this Chemical properties data, if available, is correct ~98% of the time & for remaining 2%, if any variation is there, it may be due to various other reasons e.g. the product specifications are different, product is not so common, not listed in standard database etc.

However, the data e.g. solubility, Distribution coefficient etc is varying widely. For example recently I was working on a job of recovering Acetic Acid from Liquid effluent. My team member listed few solvents used for LLE of acetic acid. MTBE was one of them.

Based on our selection criteria on different parameters when we shortlisted 2-3 solvents as most probable & economical options, we found that MTBE topped the list due to high distribution coefficient of 3.8 (As listed in one of the papers, I wont mention the link) and very low boiling point of ~55°C.

So we planned for it & invested time & money when we carried out our experiment, it was found that the D was ~0.95 or so. Initially, we were surprised by those kind of results, then after repeat tests & analysis, we re-started searching literature & found that it is also listed as 0.6.

So which one is correct?????????

Why should we rely on them????

These 2 are the critical questions, & I am sure it is faced by many process engineers from time to time.

Suggestion
Plan for intital feasibility based on the data and do some lab work before you propose anything if you don't have any prior experience on the concerned issue/system.

In the second case, if you go for any improvement planning in your existing processes be it capacity, energy saving, equipment performance or anything - you again need base data. In most of the cases you practically have Temperatures & Pressure available on your DCS or field instrument. However you do not have critical flow rates which are more important sometimes than P&T data alone.

For example when you check the performance of pumps specially in case of cooling water pumps you generally dont have accurate flow measurement.

In such cases we need to do some fundamental work of heat & mass balance across critical equipment(s). Or some tricky experience based like I use shutoff head and actual head to find out flow measurement alongwith system curve plotted based on different Q & H combinations.

Learning
Why industry do not push for providing sufficient gadgets required for efficiency / performance measurements which helps a lot in future in identifying problems, improving performances, production etc.? The cost of such installations is only a fraction of what can be saved from these exercise results.

Why a process engineer is required to do so much; wasting time & energy??????????

The problem lies with the process / project engineers itself. They do not recognize the importance of such gadgets at the conceptualization stage of the project and do not add up the fractional cost to keep themselves under targetted budget.

Everyone of us should now onwards focus; on putting these instruments in the field starting from the prelim stage of the project. It will help & save lot of money for your company and for you as well.

Get Free Updates:
*Please click on the confirmation link sent in your Spam folder of Email*

Continue to read this post...

October 25, 2007

CompaBloc - Shell & Tube may become History in future

CompaBloc - A True Cross Flow Plate Heat Exchanger - from Alfa Laval may soon replace big size conventional S&Ts in the chemical process industry due to their very high U, Clean Service for longer, Very low (~25-35%) footprint area requirement. The current article is based on our actual experience in our plant.


We were using a conventional S&T Feed Effluent exchanger in Glycol plant. It was a S&T with ~400 M2 area for 2.0 Gcal/hr heat load with estimated U of ~625 Kcal/hr/m2/°C, whereas CompaBloc used for this service is having only 131 M2 area for ~2.8 Gcal/hr with estimated U of 2850 Kcal/hr/m2/°C which is more than 4 times than conventional S&T.

Supplier

Alfa Laval (India) Ltd has introduced a high quality welded plate heat exchanger, Compabloc, that is designed for easy access, long and low maintenance, resulting in low lifecycle costs. Compabloc is designed for high thermal performance and compact installation and is available in stainless steel and exotic metal alloys. Although fully welded, it is accessible on both sides by removing side panels for cleaning, maintenance or repair.

Construction
The heart of this unit consists of welded corrugated heat transfer plates, pressed in SS or exotic materials. The absence of gaskets allows it to handle high temperature fluids and operate in chemically aggressive environment. It is ideal for any industrial application requiring efficient and economic heat transfer in a fully welded design required normally in hydrocarbon processing industries.


There are thousands and thousands of Compabloc plate heat exchangers working in various processes all over the world. For their users, they are true productivity boosters. The design of the plates inside the Compabloc has been improved, and the result is an even better operating performance and longer life.

Changes in the plate configuration provide more contact points between individual plates, which adds to the structural strength. The use of laser-welding enables the Compabloc to withstand higher pressures and temperatures. As a result, they provide up to 7% more heat transfer efficiency than previous models of CompaBloc itself.


The best news is, thanks to the modular design of Compabloc, upgrading is a very simple, straightforward process. Replace your present CP block with the new CPL block and you get a new Compabloc at only a fraction of the price.

Performance & Features
Copabloc is available in areas from 1 - 320 Square meters. The largest CP requires only 1 x 1 M2 Footprint area which saves on installation space & is very handy in case of revamps / debottleneking of existing units where normally the size / space is a major constraint for bigger size new equipments.


They can operate from FV to 35 Bar pressures and from -40°C to 350°C making them usfeul for almost every process application. Orientationwise they can be horizontal / vertical / suspended also. Suitable for Pharma, Hydrocarbon, Petrochemicals etc.

Get Free Updates:
*Please click on the confirmation link sent in your Spam folder of Email*

Continue to read this post...

October 08, 2007

Parallel Pumping - Its a Team Effort

When multiple pumps operate continuously as part of a parallel pumping system, there can be opportunities for significant energy savings. For example, lead and spare (or lag) pumps are frequently operated together when a single pump could meet process flow rate requirements. This can result from a common misconception—that operating two identical pumps in parallel doubles the flow rate.
Although parallel operation does increase the flow rate, it also causes greater fluid friction losses, results in a higher discharge pressure, reduces the flow rate provided by each pump, and alters the efficiency of each pump. In addition, more energy is required to transfer a given fluid volume.


Example
A split-case centrifugal pump operates close to its BEP while providing a flow rate of 2,000 gallons per minute at a total head of 138 feet. The static head is 100 ft. The pump operates at an efficiency of 90% while pumping fluid with a specific gravity of 1. With a drive motor efficiency of 94%, the pumping plant requires 61.4 kW of input power.

When an identical parallel pump is switched on, the operating point of the composite system shifts to 2,500 gpm at 159 ft of head.

Each pump now operates at 80% efficiency while providing a capacity of 1,250 gpm. Although the fluid flow rate increases by only 25%, the electric power required by the pumping system increases by 62.2%:

P2 pumps = 0.746 kW/hp x (2,500 gpm x 159 ft) / (3,960 x 0.8 x 0.94) = 99.6 kW

For fluid transfer applications, it is helpful to examine the energy required per million gallons of fluid pumped.

When a single pump is operating, the energy intensity (EI) is as follows:

EI1 = 61.4 kW / (2,000 gpm x 60 minutes/hour x million gallons/106 gallons) = 512 kWh/million gallons

When both pumps are operating, the EI increases as follows:

EI2 = 99.6 kW / (2,500 gpm x 60 minutes/hour x million gallons/106 gallons) = 665 kWh/million gallons

When both pumps are operating in parallel, approximately 30% more energy is required to pump the same volume of fluid. The electrical demand charge (kW draw) increases by more than 62%. If the current practice or baseline energy consumption is the result of operating both pumps in parallel, pumping energy use will decrease by 23% if process requirements allow the plant to use a single pump.

REASONS

The reason for this can be as below
  1. Due to incorrect piping layout for combined system. Generally the interconnection of the individual discharge headers to the common header is made perpendicular (TEE Connection). In such a case when the common header is not large enough to accomodate flow pulses / higher volumes then restriction in the discharge flow is very common for parallel pumps. This causes ~5 - 15% loss in system efficiency. Convert them to tangential entry to reduce entry losses & better ejecting effect to other pumps in the flow direction.


  2. Deviation of pump operation from BEP due to change in system curve after some time OR may be due to alteration made in the system which are not taken care of for changes & identification of BEP in the entire system vs pump curve. It may be due to addition of some other pump in the same system but at farther location which is often neglected as a parallel pump due to poor visibility.

  3. After few months/years of operation, generally in cooling water pumps, internal corrosion / pitting leads to variation in pump curve shifting it towards lower side of the original curve. This reduces the capacity & head of that particular pump. However, when this weared pump runs in parallel with a better pump, the better pump affects it in 2 ways - First its head is higher so it presses hard the other (damaged or weared) pump reducing its capacity further. - Second its capacity is already lower due to wear. This have double impact on overall performance. In some cases it may happen that weared pump contributes hardly 10-20%in flow consuming equivalent power.

  4. So the perception that we have two identical pumps which were working fine initially, will now also be working at best, is not good due to differential changes even in similar pumps lead to variations & they dont remain identical after some time of operation.

  5. If motor used is of different speed (which is not very common) OR even with same speed motors slip may be slightly different altering their speed in the range of 1%. This will also shift the curve of identical pumps leading to drop in efficiency. So we should check motors speed also.

  6. Use of VFD changes Pump curve by altering its speed in exponential manner. However, the system curve for many process applications, Circulating pumps, Filling pumps & specially for Boiler feed water pumps is different than exponentiality. In such cases VFD use may result in drop in overall system performance. So be careful in sugesting VFD in parallel pumping system.
All of them or anyone of them can be as severe as resulting in major loss in EI. The term Energy intensity as defined above is introduced for better understanding in terms of entire system. Our target should be to improve EI rather than improving only efficiency of the pump OR flow or Head.

More info next time........

Get Free Updates:
*Please click on the confirmation link sent in your Spam folder of Email*

Continue to read this post...

October 06, 2007

HydroPower - Is it clean or not?

Opponents of dams have long argued against putting barriers in the natural flow of a river. Dams, they point out, prevent endangered fish from migrating, alter ecosystems, and threaten the livelihoods of local communities.

Native Americans, fishing communities, and environmentalists have made these arguments in their quest to decommission four dams on Klamath River, which runs from southwest Oregon to the coast of California. But with California requiring a 25 percent reduction in the state's carbon dioxide emissions by 2020, clean energy has suddenly entered the Klamath dam debate.


However, replacing the power from these dams could result in adding combustion emissions to the environment.

Hydro-Québec, the world's biggest producer of hydropower, claims that "compared with other generating options, hydropower emits very little greenhouse gas," thus "contributing significantly to the fight against climate change."

Maybe not. Recent reports on methane emissions suggest that dams are anything but carbon-neutral.

According to recently published estimates from Brazil's National Institute for Space Research, the world's 52,000 largest dams release 104 million metric tons of methane annually. If these calculations are correct, then dams would account for about four percent of the total warming impact of human activities -- and would constitute the largest single source of human-related methane emissions.

If methane released from reservoir surfaces, spillways, and turbines were taken into account, India's greenhouse emissions could be as much as 40 percent higher than its current official estimates. But, India as a developing nation, is not required to cut emissions -- and has yet to measure methane from its 4,500 dams. And that's a problem, because while methane does not last as long in the atmosphere as carbon dioxide, its heat-trapping potential is 25 times stronger.

A Swirling Debate

In 2004, National Institute for Research in the Amazon suggested that a massive surge of methane emissions could occur when water is discharged under pressure at hydroelectric dams in a process known in the industry as "degassing."

The problem with dams is that organic matter gets trapped in them when land is first flooded, and more gets flushed in, or grows there, later on. In tropical zones, such as Brazil, this matter quickly decays to form methane and carbon dioxide.

But just how big a problem this creates is controversial. A debate has been raging for years between researchers connected to Hydro-Québec and Brazil's Electrobras, the world's largest hydropower companies, and several small teams of independent hydrologists.

According to Fearnside, if degassing emissions were factored in at several large hydropower plants in Brazil, then these dams would be larger contributors to global warming than their fossil fuel counterparts. To be precise, Fearnside suggested that during the first decade of its life, each of these dams would emit four times as much carbon as a fossil fuel plant that makes the same amount of electricity.

Fearnside's claims have triggered a firestorm. Luis Pinguelli Rosa, formerly of Electrobras but now based at the Federal University of Rio de Janeiro, claimed Fearnside had made "scientific errors," including a failure to grasp how degassing works, and so had exaggerated the emission levels.

Rosa pointed out that Fearnside had extrapolated his calculations from data taken from the Petit Saut dam in French Guyana in the years immediately following the creation of the reservoir, when organic matter, and thus methane emissions, would likely be their highest. Patrick McCully, executive director of the Berkeley, CA-based International Rivers Network, says that one of the areas of strongest disagreement among reservoir emissions researchers is how to quantify net emissions.

In a recent paper, "Fizzy Science," McCully shows that key factors influencing reservoir greenhouse gas emissions include fluctuations in water level, growth and decay of aquatic plants, decomposition of flooded biomass and soils, the amount of methane bubbling from the surface, and the amount of carbon dioxide diffusing in.

Get Free Updates:
*Please click on the confirmation link sent in your Spam folder of Email*

Continue to read this post...

September 25, 2007

Acetic Acid Failure - Part II

This is with reference to my earlier post on the topic.

After analysis, we found that the selection of worng type of pipe is causing typical failure problem.


The background details of this failure are posted in my previous article on this topic. After failure of this exchanger & associated piping downstream of it, we carried out physical inspection & boroscopy of tubes. MOC was also tested for any supplier / manufacturing defect. Following are the results.


  1. First we checked the MOC from a third party lab & got it tested for SS-316L. So that everybody is cleared about the doubt on its inferiority. This is the first reaction normally when any material failure occurs.

  2. Then we did boroscopy of tubes & found the following pics.


  3. Now this led us to the direction of Erosion caused phenomenon or some surface / Localized / crevice boiling related phenomenon which might have been the reason for this.

  4. For confirmation we checked the pipe line downstream of this exchanger & found following.

  5. a. The failure was starting at welding joints where welding slag was creating rough surfaces, Crevices and sufficient localized drop in pressure to help vaporization of liquid e.g. water, acetic acid, or toluene.

    b. The marks of erosion were higher on bottom side than on the top portion of the horizontal pipe.

    c. The marks were appearing upto a certain length but not in the whole pipe.

    d. Apart from exchanger failure, pipe failure has occured three times and in all cases it started from welding point upto a finite length.


  6. Based on this we decided not only to calculate but analysed the mixture for its IBP in the lab. It was calculated to be 120°C whereas lab measured it ~123°C at Atmospheric condition.

  7. The pressure in the system was supposed to be ~3 bar, but to increase the plant capacity operator has fully opened a valve on the reactor inlet which was downstream of this exchanger. So the pressure in the system was having a back pressure only equal to system pressure drop.

  8. This led to a situation where minor pressure drop can cause vapor formation.

  9. So whenever, there was a crevice or rough surface found in the flow path probably one of the component was getting vaproized causing higher velocity of flow.

  10. The toal flow was around 5-6000 Kg/Hr out of which only 100 Kg/hr vaporization was sufficient to reach an erosion velocity of ~8 m/sec.

  11. Therefore, the starting point was some errosion and then crevice corrosion in the area where SS grainular structure is destroyed.

  12. This is supporting the fact that there was no corrsion / erosion in the entire system except this section.


After this we are planning to install Seamless socket welded pipes to avoid such failures in future.


Get Free Updates:
*Please click on the confirmation link sent in your Spam folder of Email*

Continue to read this post...

September 18, 2007

New Hot Gas Expander from GE

GE Oil & Gas has received GE ecomagination certification for hot gas expander technology that works with a waste gas recovery system to help refineries significantly reduce their energy costs while also lowering emissions.

The hot gas expander for GE’s Power Recovery Air Train features GE’s latest technology and meets the rigid standards of ecomagination, the GE corporate initiative to address challenges such as the need for cleaner, more efficient sources of energy, reduced emissions and abundant sources of clean water.


“Energy accounts for about 50% of the total operating costs for a refinery,” said Jeff Nagel, vice president-global services for GE Oil & Gas. “Wasting flue gas, which is largely air and is a by-product of the refinery processes, means wasting a tremendous opportunity to reduce energy costs and the carbon footprint of the entire refining industry. A Power Recovery Air Train equipped with a GE expander can maximize the use of this waste gas to produce the additional power a refinery needs to operate.”

An average-sized GE expander for power recovery system is designed to recover 18 megawatts of power, thus avoiding the use of the same amount of energy from the grid, which can save a refinery operator nearly $9M electricity costs each year. The technology also avoids the emissions of 244,000 metric tons of CO2 each year – the equivalent of removing 44,000 U.S. passenger cars from the roads for a year.

Compared to a system without the new GE expander, an 18-megawatt Power Recovery Train with the new expander is designed to recover more than 148,000 megawatt-hours of electricity from waste energy every year, or the amount used by 13,900 U.S. households.

Previously, power recovery air trains were equipped with older expander technology that was unable to meet customer requirements for four to five years of uninterrupted run time. Benefiting from improvements in materials and aerodynamics achieved over the past decade, the latest GE expander can withstand heavy crude oil corrosion and erosion to deliver improved reliability and availability and meet the four to five year performance standard. “This capability sets our waste gas recovery solution apart from others available in the industry,” Nagel noted.

“With our ecomagination program, we strive to introduce and modify technologies that will be better for the environment. It's good for nature, for people and for business,” said Claudi Santiago, a GE senior vice president and president and CEO of GE Oil & Gas.

SOURCE: GE Oil & Gas

Get Free Updates:
*Please click on the confirmation link sent in your Spam folder of Email*

Continue to read this post...

September 17, 2007

Forum Update

Thanks to Mr. Milt Beychok for his postings & initiative.
Now we have ~16 Posts and 6 users in our Forum.

Request you to make it successful & welcome your suggestions for improvement.


Get Free Updates:
*Please click on the confirmation link sent in your Spam folder of Email*

Continue to read this post...

September 08, 2007

Useful Videos

I have launched a page called "Videos" for useful visuals on different chemical aspects or sometimes for some FUN also.

So Enjoy them.


Get Free Updates:
*Please click on the confirmation link sent in your Spam folder of Email*

Continue to read this post...

September 05, 2007

How to measure pump performance without flowmeters?

We all face a very common problem of how to measure the performance of an inefficient pump in absence of flow meters particularly in case of cooling water pumps where usually there is no flow meter.

Based on my past experience in energy audit for last several years I found that we know the pump is not upto the mark based on its physical apperance of corrosion, leakages, sound etc. but how to prove it based on data that too when it is delivering the design head when you measure discharge & suction pressures. This is very confusing.

Read the simple method to verify the performance. You only need the performance curve originally supplied by the manufacturer.


This is a very common problem that all of process engineers face. How to estimate the performance sufficient enough to make a decision on improvement measures be it overhauling, replacement etc.

The confusing thing is that we are able to see the problems physically, the corrosion, leakages, sound, extra power consumption BUT still feel doubtful as pressure gauge is showing a good reading near to design value on the discharge side.

If we consider this discharge head & plot it on curve to find out the flow rate it is also similar or near to design value giving a good efficiency on mathematics. This is the point where most of us fails. So what to do?

My simple approach is to start measuring from shut off head.

  1. First Read the curve for Q & H and put it in Excel table.


  2. Use simple X-Y plot to draw this H Vs Q curve.


  3. Try to fit this data in a cubical equation, which is sufficient mostly with R-sqaured = 0.999 or better generally.


  4. Calculate H value for each Q in the same table based on curve fit equation & check for any significant deviation.


  5. If deviation is found fine tune your fit data either by dividing flow rate or by multiplying using a common factor which should be incorporated in the final equation. This is a problem related to Excel as it gives large numbers in exponential form after truncation. Otherwise, if you are using any other data fit software you don't need to do it.


  6. Now start your experiment.


  7. Measure shut off head & power at this condition.


  8. Measure discharge pressure at several flow rate values by opening the discharge valve slowly. Also record the power for each point. You should consider ~4-5 points including 100% full open condition.


  9. At least two points are absolutely necessary with shut off & 100% opening.


  10. Plot these points along with original design data.


  11. Calculate flow rate from the curve based on equation derived above but considering shift in shut off head.


  12. This flow rate value is the MAXIMUM possible value of flow which your pump can give in the given operating condition.


  13. Actual flow rate will be further less depending on the corrosion, leakages etc.


  14. However, you can judge the performance which may be sufficient enough to decide the replacement or modification in the system.


  15. This will also give you an idea about your system requirement - static head and dynamic head both. Thus you can also decide if a pump with lower head is suitable or not.

Get Free Updates:
*Please click on the confirmation link sent in your Spam folder of Email*

Continue to read this post...

August 30, 2007

Roof Design - For Energy Saving

From an energy efficiency perspective, roof technology has not progressed substantially in hundreds of years, but that is changing with the use of active thermal mass components, reflective pigments and coatings, subventing, radiant barriers and other novel techniques being tested by a team led by Bill Miller and Jan Kosny of ORNL's Building Envelopes group. Their prototype roof and attic system works by reducing attic temperatures by about 22 degrees Fahrenheit during a typical summer afternoon and decreasing the amount of heat that gets transferred through the attic floor to the living space.


At the heart of new roof system is a proprietary inorganic phase change material sandwiched between two reflective surfaces made of aluminum foil. This material is installed as a dynamic thermal barrier between the roof and attic area, creating separate air channels between roof rafters. The configuration is compatible with traditional wood and steel framing technologies. Moreover, the new phase change material overcomes problems that have plagued phase change materials for the past 40 years.

"In the 1970s and 1980s the housing industry made several moderately successful attempts to use phase change materials," Kosny said. "While these materials enhanced building energy performance, they were in many cases chemically unstable, were subject to corrosion or other durability problems and suffered from loss of phase change capability."

Another shortcoming of some previous phase change materials was their susceptibility to fire. Fire is not a problem with the ORNL material, according to Kosny, who noted that ORNL researchers are working with leading manufacturers of phase change material on the development of non-flammable organic material.

In tests at ORNL, phase change materials perform like conventional materials by absorbing heat as the temperature increases. However, as the material melts it continues to absorb large amounts of heat without a significant increase in temperature. Then, as night falls and the ambient temperature around the liquid phase change material decreases, it solidifies again and releases the stored heat to the night sky, Miller said.

With an outside temperature of 92 degrees Fahrenheit, tests at ORNL's Buildings Technology Center show temperatures of conventional attics at 127 degrees Fahrenheit vs. attic temperatures of 105 degrees with the Dynamic Attic Heat Exhaust System. Kosny and Miller filed a patent last year for this technology.

"The next generation roof will consist of infrared reflective materials that are dark in color yet reflect light as if they were white," Miller said. "In addition, radiant barriers and phase change materials will be integrated into a dynamic attic system that reduces utility bills for homeowners. The conservation strategies contribute on a much grander scale by lowering peak demand on utilities, reducing carbon emissions and, ultimately, they could lead to cleaner air."

If just half of the homeowners in the U.S. made sure they had R30 attic floor insulation and used this roof and attic system, the nation could reduce its Btu (British Thermal Unit) demand by about 100 trillion Btu.

This research is funded by the DOE Office of Energy Efficiency and Renewable Energy's Building Technologies program. UT-Battelle manages Oak Ridge National Laboratory for the Department of Energy.


Get Free Updates:
*Please click on the confirmation link sent in your Spam folder of Email*

Continue to read this post...

August 27, 2007

God & Science

This story was sent to me by a friend & thought I should share it with you all.


An atheist professor of philosophy speaks to his class on the problem science has with God, The Almighty. He asks one of his new students to stand and.....
Prof: So you believe in God?
Student: Absolutely, sir.
Prof: Is God good?
Student: Sure.
Prof: Is God all-powerful?
Student: Yes.
Prof: My brother died of cancer even though he prayed to God to heal him. Most of us would attempt to help others who are ill. But God didn't. How is this God good then? Hmm?
(Student is silent.)


Prof: You can't answer, can you? Let's start again, young fella. Is God good?
Student: Yes.
Prof: Is Satan good?
Student: No.
Prof: Where does Satan come from?
Student: From...God...
Prof: That's right. Tell me son, is there evil in this world?
Student: Yes.
Prof: Evil is everywhere, isn't it? And God did make everything. Correct?
Student: Yes.
Prof: So who created evil?
( Student does not answer.)
Prof: Is there sickness? Immorality? Hatred? Ugliness? All these terrible things exist in the world, don't they?
Student: Yes, sir.
Prof: So, who created them?
( Student has no answer.)
Prof: Science says you have 5 senses you use to identify and observe the world around you. Tell me, son...Have you ever seen God?
Student: No, sir.
Prof: Tell us if you have ever heard your God?
Student: No, sir.
Prof: Have you ever felt your God, tasted your God, smelt your God? Have you ever had any sensory perception of God for that matter?
Student: No, sir. I'm afraid I haven't.
Prof: Yet you still believe in Him?
Student: Yes.
Prof: According to empirical, t estable, demonstrable protocol, science says your GOD doesn't exist. What do you say to that, son?
Student: Nothing. I only have my faith.
Prof: Yes. Faith. And that is the problem science has.
Student : Professor, is there such a thing as heat?
Prof: Yes.
Student : And is there such a thing as cold?
Prof: Yes.
Student : No sir. There isn't.
(The lecture theatre becomes very quiet with this turn of events.)
Student : Sir, you can have lots of heat, even more heat, superheat, mega heat, white heat, a little heat or no heat. But we don't have anything called cold. We can hit 458 degrees below zero which is no heat, but we can't go any further after that. There is
no such thing as cold. Cold is only a word we use to describe the absence of heat. We cannot measure cold. Heat is energy. Cold is not the opposite of heat, sir,
just the absence of it.
(There is pin-drop silence in the lecture theatre.)
Student : What about darkn ess, Professor? Is there such a thing as darkness?
Prof: Yes. What is night if there isn't darkness?
Student : You're wrong again, sir. Darkness is the absence of something. You can have low light, normal light, bright light, flashing light....But jif you have no light constantly, you have nothing and it's called darkness, isn't it? In reality, darkness isn't. If it were you would be able to make darkness darker, wouldn't you?
Prof: So what is the point you are making, young man?

Student: Sir, my point is your philosophical premise is flawed.
Prof: Flawed? Can you explain how?
Student : Sir, you are working on the premise of duality. You argue there is life and then there is death, a good God and a bad God. You are viewing the concept of God as something finite, something we can measure. Sir, science can't even explain a thought. It
uses electricity and magnetism, but has never seen, much less fully understood either one. To view death as the opposite of life is to be ignorant of the fact that death cannot exist as a substantive thing. Death is not the opposite of life: just the absence of it.
Now tell me, Professor. Do you teach your students that they evolved from a monkey?
Prof: If you are referring to the natural evolutionary process, yes, of course, I do.
Student : Have you ever observed evolution with your own eyes, sir?
(The Professor shakes his head with a smile, beginning to realize where the argument is going.)
Student : Since no one has ever observed the process of evolution at work and cannot even prove that this process is an on-going endeavor, are you not teaching
your opinion, sir? Are you not a scientist but a preacher? (The class is in uproar.)
Student : Is there anyone in the class who has ever seen the Professor's brain?
(The class breaks out into laughter.)
Student : Is there anyone here who has ever heard the Professo r's brain, felt it, touched or smelt it? No one appears to have done so. So, according to the established rules of empirical, stable, demonstrable protocol, science says that you have no brain,sir.
With all due respect, sir, how do we then trust your lectures, sir?
(The room is silent. The professor stares at the student, his face unfathomable.)
Prof: I guess you'll have to take them on faith, son.

Student: That is it sir... The link between man & god is FAITH. That is all that keeps things moving & alive.

I believe you have enjoyed the conversation...and if so...you'll probably want your friends/colleagues to enjoy the same...won't you?...forward them to increase their knowledge... this is a true st ory, and the student was none other than.........
APJ Abdul Kalam ,
The President of India


Get Free Updates:
*Please click on the confirmation link sent in your Spam folder of Email*

Continue to read this post...

August 25, 2007

Booster Pumps - Improve your vacuum system performance

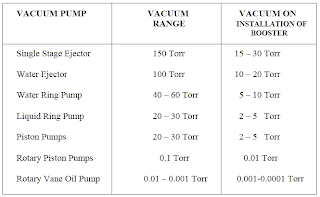
Mechanical vacuum boosters are dry pumps that meet most of the ideal vacuum pump requirements. They work on positive displacement principle and are used to boost the performance of water ring / oil ring / rotating vane / piston pumps and steam or water ejectors. They are used in combination with any one of the mentioned pumps, to overcome their limitations. Vacuum boosters pumps offer very desirable characteristics, which make them the most cost effective and power efficient option.


Major Advantages

1. Can be integrated with any installed vacuum systems such as steam ejectors, water ring pumps, oil sealed pumps, and water ejectors etc.

2. The vacuum booster is a dry pump, as it does not use any pumping fluid. It pumps vapor or gases with equal ease. Small amounts of condensed fluid can also be pumped.

3. Vacuum boosters are power efficient. Very often a combination of vacuum booster and suitable backup pump result in reduced power consumption per unit of pumping speed. They provide high pumping speeds even at low pressures.

4. Boosters increase the working vacuum of the process, in most cases very essential for process performance and efficiency. Vacuum booster can be used over a wide working pressure range, from 100 Torr down to 0.001 Torr (mm of mercury), with suitable arrangement of backup pumps.

5. It has very low pump friction losses, hence requires relatively low power for high volumetric speeds. Typically, their speeds, at low vacuums are 20-30times higher than corresponding vane pumps/ring pumps of equivalent power.

6. Use of electronic control devices such as variable frequency control drive allows modifying vacuum boosters operating characteristics to conform to the operational requirements of the prime vacuum pumps. Hence they can be easily integrated into all existing pumping set up to boost their performance

7. Vacuum boosters don’t have any valves, rings, stuffing box etc, therefore, do not demand regular maintenance.

8. Due to vapor compression action by the booster, the pressure at the discharge of booster (or inlet of backup pump) is maintained high, resulting in advantages such as low back streaming of prime pump fluid, effective condensation even at higher condenser temperatures and improvement of the backup pump efficiency.


Get Free Updates:
*Please click on the confirmation link sent in your Spam folder of Email*

Continue to read this post...

August 24, 2007

Acetic Acid Heat Exchanger Failure

We have a shell & tube heat exchanger as feed preheater in our glycol ether acetate plant where mixed feed is preheated to ~130-140°C using steam on shell side. It has failed recently & we observed few strange things.


Background

In the process of manufacturing of Glycol ether acetate (Or Cellosolve acetate) we conventionally use Cellosolve & Acetic acid and esterification reaction occurs with the water formation in CSTR reactors. Toluene is used as entrainer for water removal.


After reaction step, the product mix is sent to mix fraction column separation where All unreacted components and toluene are removed as overhead & recycled back to the reactor.

Feed is mixed with this recycle stream & sent to a preheater upstream of the reactor. The mixture is preheated to ~130-140°C using steam.

Incident

On 17 Aug when we stopped the plant for some modification, we found the organic compounds in the condensate line for the reactors. So initially we thought about some leakages in the internal coils of the reactor but while opening up the flanges in the system we found that organics are not coming from the reactor side rather coming from the header side. So we isolated entire system & traced it back to this exchanger.

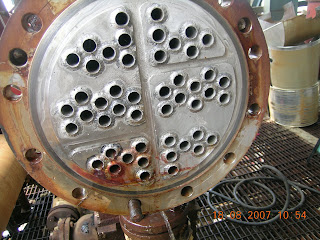
After confirmation from the drain point at max elevation, we decided to open it in the morning of 18 Aug and found this scene at site.


This is a 6 pass exchanger with organics on tube side & heating steam on shell side.


The tube failure was found on the inlet side of process fluid which is at left bottom in actual orientation also, as shown in the pic above.

It is clear from the pics that other tubes dont have even a single spot of corrsoion or leakge as shown above & below.


So what is the situation of failure at the time of opening of exchanger & why it is so?


Just another enlarged view of failed tubes at tubesheet end.........


We have inspected the tubes using boroscopy from inside & found that the actual leakage is inside the tubes at the end side of first pass (outlet side) not on the side shown (Inlet of first pass).


The picture above is showing a hole at the top left and severe pitting inside the tubes.

Our mechanical analysis is under progress & I will update this one as soon as I get those reports.

Till then I invite your comments.

Get Free Updates:
*Please click on the confirmation link sent in your Spam folder of Email*

Continue to read this post...

August 21, 2007

Fouling Factors for Cooling Water Service

Just found a list of compiled factors, so I wish to share it with all of you at one place. I will post others also on this as Update. Generally we find U values but not fouling factors, so it may be useful for many.


Get Free Updates:
*Please click on the confirmation link sent in your Spam folder of Email*

Continue to read this post...

August 16, 2007

Ethanol - Facts & Common Sense

Briefs

Brazil pioneered the use of Ethanol as a blend to gasoline for fuel use in commercial & public transport sector. Since then the science community is trying to identify alternative fuel which is easier to use, more efficient, cost effective & bla..bla..bla.......

I have read 3 major ones -
  • Ethanol,

  • Butanol (most Recent) &

  • Dimethyl Ether (DME)

You will find many pros & cons of each of them...However my first focus is are they really going to contribute energy saving, cost saving, renewability (reducing environment emmission in totality) OR NOT...............


Energy Saving

The discussion on Energy saving in the production of these biofuels is not relevant to me. Becasue if we talk about this we are going to violate fundamnetal law of energy conservation. Total energy of the universe is conserved it can neither be created or destroyed only it can change from one form to another. So why to talk about it. It is already mentioned & proved that the projections from United States Department of Agriculture (USDA), Economic Research Service Report number 814 titled "Estimating The Net Energy Balance Of Corn Ethanol: An Update" published in July of 2002 are completely misleading and there is no benefit in diverting food material for fuel production.

Its a gimmick played by US & EU to divert the attention of developing countries so that artificial food shortage can be created there & then they can improve their agriculture business by exporting food to them.


Anyway, this is not my area (May be I can discuss in comments section if somebody is interested), so we should consider the total energy in production & consumption both which are going to remain same combinedly for any fuel cycle. So if we do the comparison considering all factors including energy required for production of grains, It should not result in either deficit or surplus of the energy balance. However, no production process can have >100% efficiency. This is against thermodynamics.

It can be proven thermodynamically also by any expert. Following references are useful here


If Ethanol production is so much energy efficient (Lowest prjection of 35%) than that means every 100 Units of input energy can generate 135 Units & so on. Considering this growth, world can generate excess energy in just under 20 years based on current global consumption of ~3000 billion gallons / year of Eqv Oil and @1% growth rate in the consumption.

Ethanol production rate is kept same at same Biomass (in this maths calculation, which should have been done by so called experts with so much funding available from govt, agencies & whosoever is interested in improving his related business) be it corn, sugar cane or anything with the latest figures of efficient farming, production & conversion efficiencies which is considered only at 20 Billion gallons/year in the begining which is only 1/10 or 10% of current fossil fuel consumption.

Wow!

That means thereafter, we wont have any problem of energy shortage in the world.

Is it really so????????????????

The answer may be derived from the results of Brazil and is clearly NO.

I will post other issues related to this later as I see that


1. It is not a renewable & sustainable fuel.

2. It is going to pollute the environment in the same way as we do with fossil fuels.

3. Net energy content may be inefficient than fossil fuels.

4. Diverting attention of governments for policies related to social welfare due to subsidies.

5. No large scale sustainable future for Ethanol or any other food crops derived fuels.


Get Free Updates:
*Please click on the confirmation link sent in your Spam folder of Email*

Continue to read this post...

August 13, 2007

Catalyst to turn CO2 into fuel

A new catalyst that can split carbon dioxide gas could allow us to use carbon from the atmosphere as a fuel source in a similar way to plants.

"Breaking open the very stable bonds in CO2 is one of the biggest challenges in synthetic chemistry," says Frederic Goettmann, a chemist at the Max Planck Institute for Colloids and Interfaces in Potsdam, Germany. "But plants have been doing it for millions of years."


Plants use the energy of sunlight to cleave the relatively stable chemical bonds between the carbon and oxygen atoms in a carbon dioxide molecule. In photosynthesis, the CO2 molecule is initially bonded to nitrogen atoms, making reactive compounds called carbamates. These less stable compounds can then be broken down, allowing the carbon to be used in the synthesis of other plant products, such as sugars and proteins.

In an attempt to emulate this natural process, Goettmann and colleagues Arne Thomas and Markus Antonietti developed their own nitrogen-based catalyst that can produce carbamates. The graphite-like compound is made from flat layers of carbon and nitrogen atoms arranged in hexagons.

The team heated a mixture of CO2 and benzene with the catalyst to a temperature of 150 ºC, at about three times atmospheric pressure. In a first step, the catalyst enabled the CO2 to form a reactive carbamate, like that made in plants.


Oxygen grab

The catalyst's next useful step was to enable the benzene molecules to grab the oxygen atom from the CO2 in the carbamate, producing phenol and a reactive carbon monoxide (CO) species.
"Carbon monoxide can be used to build new carbon-carbon bonds," explains Goettmann. "We have taken the first step towards using carbon dioxide from the atmosphere as a source for chemical synthesis."

Future refinements could allow chemists to reduce their dependence on fossil fuels as sources for making chemicals. Liquid fuel could also be made from CO split from CO2, says Goettmann. "It was common in Second World War Germany and in South Africa in the 1980s to make fuel from CO derived from coal," he adds.

The researchers are now trying to bring their method even closer to photosynthesis. "The benzene reaction currently supplies the energy that splits the CO2," Goettmann says, "but in plants it is light." The new catalyst absorbs ultraviolet radiation, so the team is experimenting to see if light can provide the energy instead.Recycled carbon

Joe Wood, a chemical engineer at Birmingham University in the UK, is also researching ways of fixing CO2. "There's growing interest in using it as a recycled input into the chemical industry," he says.

The Max Planck technique has only been demonstrated on a small scale and it has a low yield of 20%, he points out. "But it looks quite promising," he adds. "The catalyst can be made cheaply and it works at a relatively low temperature."

The products of the technique are well suited to making drugs or herbicides, says Wood, "so hopefully they can improve the efficiency and scale it up."


Adopted from Newsvine.


Get Free Updates:
*Please click on the confirmation link sent in your Spam folder of Email*

Continue to read this post...

August 08, 2007

A simple way to convert waste methane

About 100 billion cubic meters of natural gas are burned off or simply vented at remote oil rigs and refineries that are not connected by pipelines. The practice wastes a precious fuel and pumps methane, a potent greenhouse gas, into the atmosphere. Technologies for compressing or liquefying natural gas in order to transport it are expensive and only make sense at large oil fields. So, researchers have been looking for viable technologies to convert the natural gas found at small, isolated oil fields into compounds that are easier to transport and distribute.

Specifically, the researchers found a simple way to convert methane into methyl chloride, which can easily be converted into petrochemicals such as ethylene or propylene, used to make plastics. Ethylene and propylene, says Johannes Lercher, a chemistry professor at the Munich University of Technology, are far easier to transport than methane is.
The current process for making methyl chloride takes a lot of energy and involves multiple steps, including first converting methane into a combination of carbon monoxide and hydrogen. In an online paper in the Journal of the American Chemical Society, the Munich and Dow researchers demonstrate a straightforward technique that uses much less energy. They show that mixing methane, hydrogen chloride, and oxygen in the presence of a lanthanum catalyst yields methyl chloride. "Capital and complexity frequently go hand in hand," says Mark Jones, a plastics and hydrocarbons researcher at Dow. "The general trend is that reducing processing steps is good."
The technique could have one drawback, though: it uses chlorine, a toxic gas. The researchers' plan includes recycling the hydrogen chloride and repeatedly using it for the reaction. "In the vision we're playing with, the chlorine would not ever get on a boat," says Eric Strangland, a chemistry and catalysis researcher at Dow and a coauthor of the paper.
However, companies that are not used to handling chlorine might initially be intimidated by the technique, says Bert Weckhuysen, a chemistry professor at Utrecht University, in the Netherlands. "Dow has a long experience with chloride chemistry, so working with chloride streams is not a big deal" Weckhuysen says. "Others companies could, at least in the beginning, be scared off due to the requirement of being able to work with chloride compounds. It requires infrastructure."

The process will also face competition. New gas-to-liquids technology, which converts natural gas into synthetic liquid fuels, is starting to become popular as an alternative to liquefied natural gas, and it's garnering the attention of oil giants like Exxon and Shell. It has not yet been widely used, though, because it's expensive to implement: it requires a lot of energy and large facilities. Weckhuysen says that if Dow could develop an affordable commercial process based on it new reaction, it could compete with gas-to-liquids technology.
Another competitor, Gas Reaction Technologies, based in Santa Barbara, CA, is commercializing a technology to directly convert natural gas into liquid fuels and chemicals. The process is very similar to the new Dow process, except it uses bromine instead of chlorine. Gas Reaction Technologies, which is working with several partners, including Cargill, expects to have facilities going within three to five years, says Eric McFarland, the company's CEO.


Get Free Updates:
*Please click on the confirmation link sent in your Spam folder of Email*

Continue to read this post...

August 01, 2007

Improve Your Boiler Efficiency

How much is the typical coal fired boiler efficiency?
Probably the best operating boiler can achieve ~80% or +/-2%.
Historically, boiler efficiency has been limited due to the minimum temperature allowed for the auxiliary equipment. Heat lost up the stack was in exchange for keeping the flue gas temperature above the water vapor dew point to protect the air heater or economizer from acid corrosion. If water vapor was allowed to condense out, rapid deterioration, due to acid corrosion, of the outlet duct and stack would also occur.

The contribution of dry flue gas is ~9-12% & ~5-8% due to presence of humidity & water in combustion products. The reason is that the flue gas temperature (generally 170 - 200°C) is limited by dew point to avoid condensation of downstream exchangers.
With the development of CHX™ condensing heat exchangers, boiler efficiency can now approach 90%. Approximately 1% gain in boiler efficiency can be expected for every 20° C reduction in flue gas stack temperature. Therefore if we can lower it to ~90°C or so, we can practically recover more heat with total thermal efficiency increase from 80% to ~88% or so.

In the CHX™ condensing heat exchanger, all gas wetted surfaces are covered with DuPont Teflon~. The Teflon covered heat exchanger surfaces are impervious to all acids normally resulting from the combustion of fossil fuels. This allows the flue gas to be cooled to below the water vapor dew point with no subsequent corrosion of the heat exchanger surfaces. If this heat is not recovered it will account for a boiler's second largest thermodynamic loss.
CHX™ condensing heat exchangers use a single gas pass to remove both sensible and latent heat from the flue gas. The flue gas enters the Teflon covered heat exchanger through a carbon steel inlet plenum at the top and flows downward across the horizontal banks of heat exchanger tubes and exits the heat exchanger through an FRP outlet plenum on the bottom of the heat exchanger. The cold water flows through the heat exchanger tubing. For optimum heat recovery, the heat sink fluid flows countercurrent to the flue gas.
As the flue gas temperature reaches the water vapor dew point at the tube surfaces, condensation occurs. Due to the hydrophobic nature of Teflon, droplets of condensate form and fall as a constant rain over the tube array. This provides two important advantages. It enhances the latent heat transfer and at the same time keeps the tube surface clean.
The modules are manufactured in a number of different sizes. The variety of module sizes and the modular construction allow the CHX condensing heat exchanger design to be optimized for each application.
The CHX™ tubing, in water cooled applications, is 1.125 in. O.D. alloy C70600 covered with a 0.015 in. thick extruded layer of FEP Teflon. The inside surfaces of the heat exchanger shell are covered with a 0.060 in. thick sheet of PTFE Teflon. During fabrication, the tubes are pushed through extruded tube seals in the Teflon covered tube sheet to form a resilient Teflon to Teflon seal. This ensures that all heat exchanger surfaces exposed to the flue gas are protected against acid corrosion. Tube connections are made outside of the heat exchanger shell.
To protect the Teflon, maximum flue gas inlet temperature is limited to 260° C. The maximum water inlet pressure and the maximum water outlet temperature are 150 psig and 120° F respectively. CHX™ heat exchangers are installed as passive systems in order to assure that these limitations will always be met.
The CHX heat exchanger can also be used to heat air. The materials of construction and the maximum operating parameters vary somewhat from above.
The most common application for a CHX™ condensing heat exchangers is the recovery of waste heat to preheat boiler make-up water. Preheating make-up water can increase boiler efficiency 3-5% or more. The heat recovered by a CHX™ condensing heat exchanger can offset much of the extraction steam required by a low pressure feed water heater or deaerator. This offset will reduce fuel consumption while maintaining a fixed net steam output, or when required, it can increase the net steam output by maintaining the same fixed fuel consumption.
Heating make-up water is not the only heat recovery application for a CHX™ condensing heat exchanger. CHX™ units can have a number of other uses in the plant environment. Applications range from building heat to heating process streams in food processing chemical plants, and various pulp and paper applications.
In one actual installation, a midsized industrial plant has been saving an average of $1,000 per day for the past 10 years in energy costs by heating process water with boiler flue gas. The passively installed system utilizes 160,000 tph of 333° F glue gas to heat 550 gpm of process water from 90° F to 136 ° F. The flue gas is cooled to 125 °F. The additional heat recovery has in effect increased the capacity of the plant without requiring the purchase of another boiler. This CHX™ heat recovery system paid for itself in less than 25 months.
CHX™ units can also heat water or process streams indirectly. When a process steam is incompatible with the CHX™ unit design, water or other liquid heat sinks can be circulated in a closed loop through a CHX™ condensing heat exchanger. A closed loop system can be used to heat process streams that are abrasive, corrosive or have a pressure higher than the CHX™ unit design pressure. A closed loop system can also be used for flue gas reheat or in some cases to cool flue gas to a lower temperature where required.
For the past 16 years CHX™ condensing heat exchangers have successfully demonstrated their ability to operate below the acid and water vapor dew point to recover low level heat from fossil fueled boilers, HRSG'S and process dryers. While a majority of CHX™ heat exchanger installations have been retrofit applications, there have been several cases where they were included in the heat balance design for new construction or plant expansion.
Based on our experience, the most efficient use for CHX™ condensing exchangers in the future will be for new construction or plant expansion when the customer and their A&E company engineers recognize in the design phase that there will be a continuous requirement to heat a large volume of cold water for a specific use. When the condensing heat exchanger is an integral part of the total project heat balance design it provides the opportunity to maximize the use of the heat recovered to the benefit of the total system heat balance. Another advantage is that the installation cost is typically lower than the cost to interface with existing equipment in a retrofit application.

If you find it useful or would like to add similar developments, kindly let me know.


Get Free Updates:
*Please click on the confirmation link sent in your Spam folder of Email*

Continue to read this post...

July 30, 2007

Frictionless Compressors

Are they right for you?

Compressors that run on frictionless bearings are an enticing prospect. Dan Foss Turbocor, Inc. is now marketing a line of compressors that use magnetic bearings to provide essentially frictionless operation. These compressors have been on the market for about three years, and now McQuay International is incorporating the compressors into their new line of frictionless chillers.

Using innovative technology that levitates the compressor shaft in a magnetic field, the compressors operate without metal-to-metal contact, making them more efficient, and eliminating the need for an oil management system. Turbocor has recently received three prestigious awards for this design: the ASHRAE/AHR Expo "Energy Innovation" Award in 2003, the Natural Resources Canada's Energy Efficiency Award in 2003, and the U.S. Environmental Protection Agency’s Climate Protection Award in 2004.

How are they different?
Here are some of the features, benefits, and concerns to help you decide whether frictionless compressors (or McQuay’s frictionless chillers) are right for you. Each feature is discussed in more detail below.

· Magnetic bearings.
· Oil-free design.
· Low noise Level
· VFD control.
· Soft start.
· Smaller and lighter than conventional compressors.
· Uses a centrifugal compressor.

Magnetic bearings
A digitally controlled magnetic bearing system, consisting of both permanent magnets and electromagnets, replaces conventional lubricated bearings. The only rotating part—the compressor shaft—is levitated and held in place by magnetic bearings, eliminating metal-to-metal contact, essentially eliminating friction.

Four positioning signals, sampling six million times per minute, hold the levitated position to within 0.00005” of center. The advantages of this technology include:
  • No friction. This can improve energy efficiency by 2-4%.
  • No metal-to-metal contact, therefore less wear on moving parts. Turbocor claims that maintenance costs are about half what they are for conventional technology.
  • The frictionless bearings, in conjunction with variable frequency drive (VFD) control, allow the shaft to spin at high speeds (up to 48,000 RPM) and give good speed control.
  • Very little vibration. Because of no physical contact, vibrations are small and tend to be self-dampened.

The magnetic bearing system, however, is more expensive and it takes some energy to operate the system. The levitation system on current models uses approximately 180 watts, or about 0.5% of the operating energy. Contrast this to 2-4% for conventional bearings, along with a lubrication system that (according to Turbocor) can use up to 10,000 watts.

Oil-free design

The biggest benefit to eliminating oil from the system is that it eliminates the need for a lubrication system, which can include oil pumps, sumps, oil separators, heaters, coolers, etc. In comparing the costs of two proposed systems, it important to consider lubrication in estimating both the capital and operating costs. The other disadvantage of having oil in the system is that it can reduce the effectiveness of heat transfer in the coil. The effect of this, however, is small. While the Turbocor website suggests that heat transfer effectiveness can be reduced by 15% or more by the presence of oil, this will most likely translate into a somewhat smaller effect on overall system efficiency.

Low noise level

The Turbocor compressors, by all reports, make significantly less noise than the comparable screw compressors. What noise there is tends to be high frequency, which is relatively easy to attenuate.

VFD control

The big potential savings of this system comes from the integrated variable frequency drive. This provides good speed control, allowing the system to run up to 48,000 RPM and (because there is no friction in the motor) it can also operate efficiently at low loads.

In addition, the compressor has automatically controlled inlet guide vanes that unload further in low-load conditions. These features give the system an excellent integrated part-load value (IPLV) rating. Many chillers in HVAC applications are running at part load a vast majority of the time, making them an excellent application for the frictionless system.

Turbocor claims that they have achieved an IPLV rating as low as 0.375 kW/Ton, compared to 0.63 kW/Ton for the Turbocor at full load, and 0.5 kW/Ton being considered a very good rating. Herein lies the key to a successful application of Turbocor. If the chiller will be operated at part load a good proportion of the time, a frictionless chiller is worth considering.

Soft start

An added benefit of having the integrated VFD is that the motor has a built-in soft start. Turbocor uses a unique method of soft start that ramps the motor up gradually, making inrush current effectively the full load current. On Turbocor’s website, they list the inrush current as 2 amps, or 5 amps in some places, meaning, presumably, that the ramping up process starts with this very low current. It is not clear how this information is useful, since the information about inrush current is generally used for sizing circuit breakers. The breaker would simply have to be sized for the full load amperage.

Small and Lighter

Using permanent magnets in the motor, rather than electrical windings as in an induction motor, reduces the size and weight significantly. In addition, by running the shaft at high speeds, they are able to use a smaller, lighter, shaft. According to the manufacturer, the Turbocor compressors, at 265 lbs., are one-fifth of the weight and half the size of an equivalent conventional compressor.

Uses a centrifugal compressor

Centrifugal compressors tend to be more efficient than screw or scroll compressors, and take advantage of speed control more effectively, but they are usually only available in larger sizes. By using the smaller shaft, they are able to take advantage of the centrifugal compressor technology in a smaller size than is normally available.


Is it a Right Choice - Baby?
That depends. The design of these compressors is clearly innovative, elegant, and efficient, and all indications are that it is a quality product. The idea of using magnetic bearings is provocative, but it turns out that this feature in itself is rarely enough to justify considering the 50-70% price premium you are likely to pay for a frictionless compressor. However, with associated benefits, it may be well worth considering.

Remember to take into consideration not having to include an oil management system, and perhaps easier and quicker installation. Certainly in an application where the chiller runs at part load much of the time, such as in many HVAC applications, the efficiency may be much better. In that case, the IPLV rating will be a better indication of the relative performance than the full-load rating, but it will probably be worthwhile to have an engineer do a full analysis of the relative costs based on your particular application. The more your chiller will be running at part load, the more attractive this product will be. Reduced maintenance costs may tip the scales in favor of going frictionless.


Get Free Updates:
*Please click on the confirmation link sent in your Spam folder of Email*

Continue to read this post...