July 09, 2006

Cooling Towers: Not the Coolest One

INTRODUCTION
Cooling tower is basically a heat exchanging device in which heat exchange takes place by virtue of mass transfer potential between process fluid (cooling water) and utility fluid (ambient air). Hence, it performs evaporative cooling of water.

Cooling tower is an equally critical section in a plant because the on-stream utilization of main plants and efficiency of the manufacturing process depends on the performance of cooling towers also. It’s the most neglected area of the plant where huge potential of savings lie within the existing tower volumes.

This article is covering certain practical aspects of cooling tower performance & its operation.

NEED
Very high cost of cooling water e.g. RS. 2 to 6 /m3 of treated water doesn’t permit plant operators to operate in an open loop cycle in the cooling water circuit. Hence, the closed loop cycle is selected in almost all process plants all over the world.

In a closed loop cycle, the power consumption required for cooling the water (in cooling tower fans only while considering pumping cost as almost same in both the cases) varies from 0.02 to 0.04 kWh/m3 of water so, the cost of cooling of water ranges from RS. 0.02 to 0.20/m3 in Indian conditions. This is almost 100 times lesser than the cost of cooling water in a once through cycle. That’s why it is customary to use cooling towers in any chemical process industry, especially in hot climatic conditions.

THEORY
Cooling towers work on the humidification principal, which is driven by the mass transfer potential between cooling water & ambient air. However, in actual operation it is a combination of different driving forces between water & air. Contrarily, the cooling tower design is considered based on the enthalpy difference as driving force, because this is the least driving force available throughout the tower at any point of time. This occurs when the passing air is completely saturated. In all other cases, more than one driving forces are available between air & water. So, the most popular merkel equation is only a conservative way of modeling of a cooling tower.

However, merkel equation is considered to be the most effective way of designing a cooling tower by many engineering institutions & academies. For details of merkel equation please refer Cooling Towers: Design & Operation on
www.cheresources.com

CONSTRUCTION
It’s a packed bed tower in which structured packings are used in a stacked loading pattern. Conventionally, these packings are called fills. These fills are means of providing larger surface area within a confined available volume as it is used in many conventional applications e.g. in distillation, absorption, saturators etc.

Construction-wise cooling towers are of two types mechanical draft & natural draft towers. Natural draft towers are very large stack type towers in which flow of air is through buoyancy force because of density difference. Mechanical draft towers are having induced/forced draft fans, which help in flowing air through the circulating water. These are sub classified based on flow pattern of air through the tower e.g. cross flow & counter flow towers.

OPERATION
Cooling towers are designed based on the worst condition of ambient air in terms of highest wet bulb in the area which prevails for one or two months only; during the year and, maximum cooling load from the process side as considered in the over design of process equipments. Also, the self, inherent design margin is always available in these towers because of their availability in standard size modules. Hence, every cooling tower practically has many margins in the existing tower volume for the desired cooling of water e.g.

  • Maximum Wet bulb during the year.
  • Maximum cooling load from process side.
  • Capacity margins from process side.
  • Self-inherent design margins due to modular construction.

Therefore, the cooling towers must give better results than anticipated in the design. The direct measurement of cooling towers performance is the approach of cooling at the outlet of tower. Hence, even if towers are operating at design value then too it is underutilized. We’ll see in the next paragraphs that how it is happening in actual operation.

  1. Effect of Water Temperature

    The first impact of design margins from the process side is that normally cooling water flow is kept same as envisaged in the original design & process side heat load may be lower (due to capacity over design or for any other reason). Therefore, the cooling tower operates at lower cooling water return temperature (the temperature of cooling water at the inlet of tower).

    The impact of lower return water temperature is that the cooling approach must reduce by ~50% of the difference in the design & actual return water temperature. For example: If a tower is designed for 4°C approach for the cooling of water from 44°C to 34°C and actual return water temperature is 42°C then you must get an approach of 3°C instead of 4°C. The range of cooling will be 9°C against design value of 10°C. Thus, if your return water temperature is 42°C against design value of 44°C and you are getting design approach of 4°C that means your cooling tower is operating inefficiently.
  2. Effect of Wet Bulb
    Similarly, since the tower is designed based on the wet bulb of 30°C, which prevails only for around two months during the year, it has to run at lower wet bulb temperature e.g. say 28°C for rest of the year. In this case, the approach of cooling will go up by ~50% of the difference between design & actual wet bulb resulting in actual approach of 5°C instead of 4°C. However, total range of cooling will also increase in this case by ~50% of the difference in actual & design wet bulb i.e. 44°C to 33°C means range of cooling will increase from 10°C to 11°C.

    Yes, one should not infer from these two examples that the thumb rules expressed here are valid for any changes in the temperatures. Instead, it is always governed by the equilibrium conditions & for larger changes one should go for proper evaluation procedure as described later in this article.
  3. Effect of Water Loading
    Cooling towers are normally supplied in standard modules called tower cells. Therefore, the cooling water is distributed equally on each cell in parallel configuration. However, in actual operation it deviates from what it should be (Average water flow/cell). This causes for example 80% water on one cell & total water flow being the same it will be 120% on the other. Even the same cell might have different water loading on both sides of distribution deck. This much deviation may result in ~5-10% rise in cooling approach.
  4. Effect of Air Distribution
    Similarly, the imbalance in air loading in each side of every cell may cause 1.5 times more negative impact as compared to effect of disturbed water loading. Thus, 20% deviation in air distribution may cause ~10-15% rise in cooling approach.
  5. Effect of Air Short Circuiting
    By now it is clear that operators has to regularly monitor the performance of their cooling tower especially at different loads & at different ambient conditions. More appropriately, the comparison of actual approach with the design approach is not a good & actual indicator of its performance.

PERFORMANCE MONITORING
Following are the general guidelines for evaluating the operational performance of the cooling towers.

  • Scheduled monitoring should be followed especially covering all seasonal changes.
  • Intermittent & need based monitoring at different loads.
  • Adjustment of water loading.
  • Regular inspection for air short circuiting, fills displacement, end side gaps in the walls.

According to Merkel Equation, one can go as per the following procedure for the performance evaluation of an existing cooling tower.

  1. Measure Air velocity through the tower in each cell.
  2. Consider Design Wet bulb of inlet air & L/G as given in data sheet.
  3. Exit wet bulb temperature of air by the heat balance on waterside.
  4. Given the exit density of wet air find out exit dry bulb, which should lie, in between its wet bulb & water inlet temperature.
  5. Now find out the inlet dry bulb temperature of air from the heat balance on airside. Of course, these two heat balances of airside & waterside must be same.
  6. Now calculate the equilibrium enthalpy of wet air at inlet & outlet corresponding to the water temperature of that side.
  7. Find the difference in equilibrium enthalpy & actual enthalpy of wet air & take reciprocal of it, for each increment in water temperature from the bottom to top of the cooling tower.
  8. Sum up the average of reciprocals between two intervals & thus reach to the top of cooling tower.
  9. This will give you the No of transfer units overall NTUG. This is the parameter, which is useful in predictions because the available numbers of transfer units are going to remain same in all cases.
  10. Now find KaV factor by multiplying NTUG with the airflow rate. This factor is the indicator of rate of mass transfer between water & air and is analogous to mass transfer coefficient in distillation/absorption unit operation.
  11. Repeat procedure from item 1 - 10 for actual operation & find out the cold-water temperature & expected ATE.
  12. Compare expected ATE with actual ATE to find out the performance of cooling tower.
  13. Establish reasons for the deviation found in item 12.
  14. Take corrective actions for improvement.

This Article is not yet complete, I will refine it & add more info later when I get some time.

Get Free Updates:
*Please click on the confirmation link sent in your Spam folder of Email*

Continue to read this post...

June 02, 2006

Technologies Required

Currently, I am looking for the following Technologies

  1. Ethanolamine using Ammonia & Ethylene Oxide.
  2. Concentration techniques to improve MEG concentration from a mixture of 11% MEG & Water.
  3. Nonyl Phenol.
  4. Amyl Alcohol recovery from Fusel Oil.

Get Free Updates:
*Please click on the confirmation link sent in your Spam folder of Email*

Continue to read this post...

June 01, 2006

CO2 : Bone of Contention

Interest in recovery of carbon dioxide (CO2) from flue gases / any other gas is being propelled by multiple factors, which may vary from merchant CO2 market, Enhanced oil recovery (EOR), and pressure of GHG emissions. In fact, it has always been a problem to all.
Issues
1. Low CO2 Partial Pressure Flue gases have very low CO2 partial pressures because they are typically available at or near atmospheric pressure with CO2 concentrations of typically 5 to 15 vol% except other gases e.g. Distillery Biogas or Waste gas from reactors where it can go as high as 50-60% also.
The overall energy consumption invariably results in unattractive economics due to compression requirement which is higher than the cost of recovered CO2. The only commercial absorbents active enough for recovery of dilute CO2 from atmospheric pressure gas are monoethanolamine (MEA) and other primary amines including the newly developed hindered amines.
2. High Flue Gas Temperature Hot flue gases can cause solvent degradation and decrease absorber efficiency. The flue gas must be cooled to a water dew point of 50 °C prior to entering the absorber. This is accomplished through an scrubber which may require SO2 OR H2S scrubbing also if need be, or in a direct contact water cooler. This DCC can be used as a good resources for low grade waste heat using heat pump.
3. Regeneration Energy. Absorbents that are effective at low pressure requires higher regeneration energy due to higher chemical activity. The design challenges are to minimize regeneration energy by selecting a solvent with a relatively low reaction energy, and to use low-value heat sources to provide this energy.
4. Other Components. Other gaseous components e.g. SOx, NOx, H2S etc. are the major problematic constituents which complicate the overall design efficiency of the CO2 recovery system. They add to many additional steps e.g. removal & pre-treatment. Also cause corrosion & therefore metallurgical demands also goes up for the system design adding to capital requirement.
5. Foriegn Material. Flue gases generally carry ash, soot etc hence require filtration/separation of them as they tend to foul solvents/absorbents on permanent basis. Since, solvents are generally very costly manufacturers can't afford to loose them.
6. Value or Uses. This is the biggest factor which controls the entire business strategy for CO2 recovery plants. The major uses are, as mentioned above, merchant market which is mainly dry ice market and EOR market where full potential is stil not tapped and technology is also in the intital phase.
7. Nitrogen. A gas which does nothing but compel to do everything. In most of the cases, the nitrogen content is so high which occupies space, reduces effective partial pressure of CO2, carries heat & solvent and can cause up to 50% higher capital requirement compared to the case if nitrogen is not there. BUT, the removal of nitrogen itself is a matter of great deal, so better to leave it unless volumes are large enough.
8. Mode. System design also depend on the final objective of CO2 removal system. The costs are significantly different if CO2 is to be recovered in comparison to the case when the purpose is removal only.
Technologies
Different technologies which are available currently vary widely as can be seen below.
1. Chemical Absorption. As discussed earlier, the low pressure system can work only on chemical solvents other technologies are out of context when partial pressure of CO2 is less. The probable pressure range may vary from 5 to 10 Atm of partial pressure below which only chemical absorbents are feasible such as Potassium Carbonate based systems, MEA based systems or in the latest developments hindered amines.
The operating costs are higher in this case due to higher reactivity of the solvent with CO2 & hence, need more heat input.
2. Physical Absorption. When CO2 partial pressure is more than either physical or compbination of chemical & physical solvents can be used to minimize the operating costs depending on the requirement of final level of CO2 in feed gas i.e. total CO2 recovery. Water is the cheapest solvent out of them. Others such solvents may be Selexol etc.
3. Membrane Process. Membranes suffer from both the cost of compression and heat exchange to obtain a high pressure feed and also they produce an impure CO2. The pressure range may start at 25 Atm level. There are currently no commercial applications of membranes for recovery of CO2 from flue gases, though they have been used in large EOR projects to recycle CO2 from the associated gas. The presence of fly ash and the effects of trace components such as SOx, & NOx are also potential complications.
The most likely applications for membranes are in small skid-mounted plants where an impure CO2 product is acceptable and offshore applications that can take advantage of their compact size and low weight. Membrane-amine and membrane-cryogenic separation hybrids have been considered for special applications such as offshore locations where again their compact size and low weight are beneficial.
4. Cryogenic Separation. Cryogenic separation of CO2 is still at conceptual stage due to very low concentration & hence, cryo level cooling requirement. For more info on this you can look at my article at http://cheresources.com/ammonia.shtml.
5. PSA Separation. Carbon dioxide separation through PSA is offered in the Low Cost Ammonia Process (LCA). PSA is scalable and may be more economical because of efficient carbon dioxide recovery at higher pressures. However, further development in this direction is essential for the recovery of high purity carbon dioxide as desired in many cases. However it is comparatively better than Membrane process in terms of tolerability limits for feed gas for membranes.
Costs
A. Fixed COST FACTORS
1. Equipment Size
Cost of CO2 removal or recovery vary depending on many factors.
The first & most important is the total gas flow rate which directly affects the equipment size. Interestingly, the CO2 concentration in the feed gas does not affect the absorber column sizing. The absorber column dia is directly proportional to square root of gas volume flows in (Nm3/hr) & can be approximated with a mutiplying factor of 0.8 to 1.5, thus can be represented as below.
Absorber Column Dia (Meter) = A x (Feed Gas Flow)^0.5
Where,
A = 0.8 to 1.5
Feed Gas flow is in Nm3/Hr
Clearly, the CO2 concentration is not in the role which is indirectly included in total gas flow.
However, it affects the height of the column directly. A factor is a function of absorbent properties. Currently availabe best solvents can offer A = 0.8 or more.
Similarly Stripper can be approximated by the following equation.
Stripper Column Dia (Meter) = S x Da x (Vol% CO2 in Feed)^0.5
Where,
S = 0.25 to 0.5
Da = Absorber Dia calculated above
Please note that these are the approximations only for preliminary cost estimates for carrying out design feasibility studies.
3. Solvent Circulation
The solvent circulation rate can be correlated to CO2 partial pressure which is the governing factor depending on the nature of solvent. For physical solvents, circulation will be more due to higher vapor pressure of CO2 over solution whereas it will be less for chemical solvents.
Circulation rate (Te/hr) = C x CO2 partial pressure in feed gas (Atm.)
Where,
C = solvent factor which is,
= 200 for chemical solvents &
= 200 - 300 for physical solvents.
B. VARIABLE COST FACTORS
4. Energy Costs
Steam consumption in totality varies widely among different type of solvents. It ranges from 500 Kcal/Te of CO2 to 1000 Kcal/Te of CO2. The best part is that all the heat required is low level heat upto 3-4 Atm pressure.
5. Power Costs
Major power consumers are flue gas blowers and solvent circulation pumps. Based on above equations power consumption comes close to the following correlation.
Power Load (Pumps) kW = P x CO2 partial pressure in Atm.
Where,
P = 120 to 160
For flue gas blower, it varies according to the CO2 concentration in feed gas.
Blower Power kW = B x Feed gas flow Nm3/hr.
Where,
B = 0.040
Other costs include various utilities including cooling water, Solvent losses etc out of which solvent losses are the major portion & may vary from 5 - 10 % of the total operating cost.
Conclusion

The technology to recover CO2 from flue gases is commercially available and, though mature, is being significantly improved. The process economics greatly depends on the size of the plant. This paper provides approximates for establishing preliminary estimates of fixed & operating costs. A 1000 te/d plant of conservative design can produce CO2 for $30/tonne or from coal-fired flue gas. However, 4600 te/d single-train plants are possible. Economy of scale, together with the ongoing development in improving the solvent properties (e.g. MHI has developed an hindered amine based solvent KS-1 which is supposed to reduce the production cost for low pressure systems such as recovery from flue gases), have the potential of delivering CO2 at a price much lesse than that of the reference 1000 te/d plant.

Get Free Updates:
*Please click on the confirmation link sent in your Spam folder of Email*

Continue to read this post...

May 27, 2006

Ammonia: Counting Energy

The actual performance of any chemical process plant can be measured by only two terms, energy consumption level and on-stream/reliability factor. These are the two overall indicators of the plant performance out of which reliability factor also contributes to the energy consumption level. Hence, it becomes inevitable in an energy intensive unit like fertilizer industry, to keep a close look on this aspect of plant performance. This in turn will affect the productivity and profitability.


The expected annual energy consumption in ammonia production is of the order of 108 gigacalories in India alone that is equivalent to ~11 to 12000 MSm3 of Natural Gas or around 10 million tons of naphtha. Hence, it is most likely today to focus on proper analysis of bottlenecks & deficiencies in an existing plant while absolute analysis of technology at grass root level is also crucial with great care in its selection.


This study has been divided in four major parts, the overall loss structure, brief analysis of sectionwise losses & their remedies, losses through cooling water, and finally the role of catalysts in overall energy efficiency of the plant.


The Bares
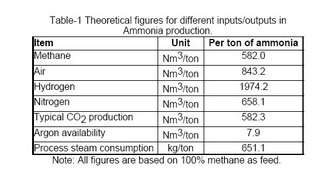
It is only indicative to mention here the theoretical minimum requirement of energy, i.e. the thermodynamic requirement to produce one ton of ammonia is ~4.47 gigacalories. Table-1 shows the minimum requirement of various inputs per ton of ammonia.


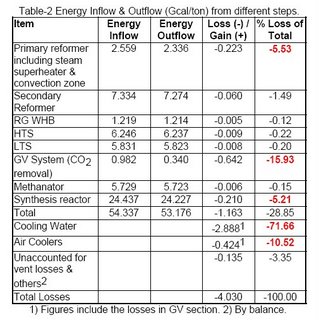
Table-2 shows the energy inputs to the different steps of ammonia production, versus energy outflow from those steps. The figures depicted in this table are for a NG based ammonia complex with conventional steam reforming process of manufacturing.


The total estimated typical losses as shown in Table-2 are of the order of 4.0 Gcal/ton of ammonia, which is around 90% of theoretical requirement, i.e. we need almost the double of thermodynamic requirement in the current trends. This indicates the need for proper energy management, analysis, monitoring, & operation for an efficient ammonia producer.


Overall Loss Structure

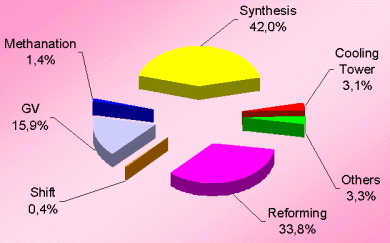
The losses distribution diagram as shown in Figure-1 represents the major losses in ammonia plant. Another diagram (see Figure-2 and Table-3) shows losses in terms of process efficiency at different steps.


Obviously, the synthesis section & reforming section are the two most inefficient operations because of irreversibility of the concerned process steps involved.
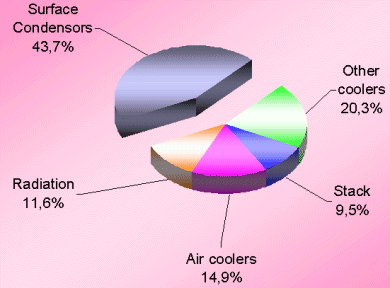
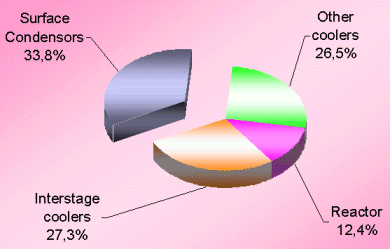
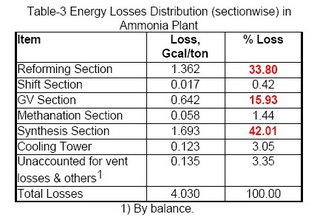
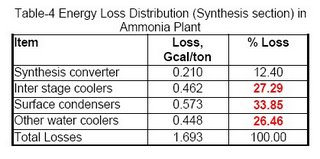
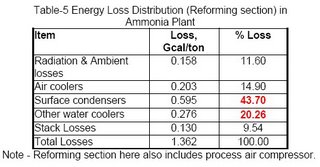
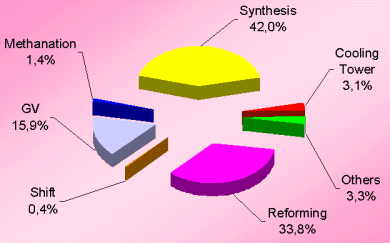
Figures 3 & 4 (also see Table-4 & 5) for losses in synthesis & reforming sections are indicating the need of new developments in these sections, to avoid the major chunk of energy loss in cooling water.


The very first reason of ~71% of total energy loss going to the cooling water is that the low-level heat can not be recovered efficiently in absence of cooler streams. Moreover, conventional ammonia manufacturing technology does not have many margins to do so. Therefore, we are left with the option to have minimum process streams of low level energy that can be utilized for preheating cooler streams.


The second big contributor is the energy loss through surface condensers of steam turbines. For all three big compressors namely synthesis, process air & ammonia refrigeration compressor, generally steam turbines are being used in the present scenario. The condensing load of these three surface condensers is ~1.3 Gcal/ton which is ~32% of total energy losses. Therefore, it is essential now to consider some alternate drives for these compressors.


The third contributor to the higher energy consumption in an ammonia plant is the conversion efficiency of different catalytic reactors by virtue of which we have to play with bulk recycle streams. Developments towards increase in the conversion efficiency at reduced cost will make a difference in the near future.


Sectionwise Analysis


Reforming Section

a. In the conventional process, steam reforming is done in a fired furnace heater. This increases the heat loss from reformer surface to ambient through air convection. The energy loss is predicted as around ~0.16 Gcal/ton of ammonia (Table-5). This loss however, can not be reduced economically unless the technology eliminates the use of fired furnace type primary reformers e.g. the use of GHR & CAR, where this loss is minimal (See my article - Ammonia : Steps Ahead).


b. Massive amount of low level heat, from the stack of convection zone of primary reformer, is rejected into atmosphere. This loss of heat from flue gases is unavoidable because of dew point limitation of sulphur & nitrogen oxides. However, it should be lowest according to the fuel specification beyond which it is an additional loss. The same is the case with the stack of fired furnace steam super-heater.


The estimated typical design loss for a particular plant is 9.0 Gcal/hr that is equivalent to around 0.130 Gcal/ton of ammonia. Note that each 10°C reduction in stack temperature costs around ~0.012 Gcal/ton of energy. The stack losses can not be eliminated as long as fired furnace type heaters are there in existence. However, in an existing plant this can be reduced to some extent by using some energy analysis tool like pinch or exergy analysis and by considering the following options:


o Reducing the heat duty of primary reformer by shifting its load on secondary reformer up to certain optimized extent permitted by PGR unit in the back end.
o Explore the possibility of installation of new heat recovery coils.
o Explore the possibility of expanding surface area of existing coils.


The recent improvements eliminate the fired steam superheater in this section to minimize the losses due to inefficient combustion process. The high-pressure steam, generated in the ammonia plant, is now being superheated by the process gas itself downstream of the RG boiler.


c. Another Loss of ~0.2 Gcal/ton in this section is through air coolers provided to cool the treated overhead vapors of process condensate with the old system of LP stripper. This loss has been already eliminated in the newer versions of the ammonia plant by incorporating MP stripper in place of LP Stripper.


Shift Section
The water gas shift reaction is a desirable one for CO2 production, which is used as raw material for urea production. This section doesn't have any significant energy loss except through surface losses from the reactors.


CO2 Removal Section
This section of ammonia plant is the major energy consumer after cooling water system (See Table-2). This is because of the involvement of the thermally very inefficient process of distillation. This is mainly because of low-level heat dissipation at various stages of the process either in cooling water or in air coolers.

a. In this process, the solvent is recycled back after cooling for absorption. The cooler stream of GV for polishing section of the absorber is cooled in air coolers where huge amount of low level heat is dissipated in the atmosphere.


The estimated amount of energy loss is around 13.0 Gcal/hr or 0.19 Gcal/ton of ammonia. Part of this heat can be recovered by developing an appropriate scheme for an existing plant. It is estimated that around 5.0 Gcal/hr of energy can be recovered with a payback period of less than 6 months. This is equivalent to energy savings of around 0.07 Gcal/ton of ammonia. However, it can be eliminated also if a feed gas saturator is considered, which has a very good payback of ~1.5 years.


b. The second major loss in this section is through the cooling of product CO2 by cooling water. The estimated energy loss in the cooling water through CO2 is ~0.45 Gcal/ton of ammonia. This loss can not be eliminated because of low-level heat content of CO2 stream.


Synthesis Section
The major part of the losses, i.e. ~88% in this section is through the cooling water, which we are going to discuss in the next section. The remaining part is because of surface losses through the synthesis converter.


Losses Through Cooling Water
It is well known that ~71% of the total energy consumed in the conventional ammonia manufacturing process is lost through cooling water. That indicates a direct energy loss of ~2.9 Gcal/ton of ammonia. The break-up of this energy loss is given in Table-2.


The major contributor to this 2.9 Gcal/ton of energy loss is through the surface condensers of three major compressors, which have a cooling load of ~1.3 Gcal/ton of ammonia. Therefore, an alternate option is needed either for compression method or for reduced steam input or the minimal use of condensing type turbines.


The use of gas turbine, in place of steam turbine, for process air compressor in the new plants is an effective way to reduce these losses to some extent. However, this device can not be used for all compressors because of total steam balance in the complex and especially for the synthesis compressor. However, the surface condenser losses for the ammonia compressor can be compared based on the economic viability of vapor absorption refrigeration cycle vs. mechanical refrigeration cycle. If it becomes economically feasible then the total saving of ~0.4 Gcal/ton can be obtained including ~0.3 Gcal/ton from process air compressor on gas turbine.


Another contributor to energy loss in this category is the use of interstage coolers of compressors. This loss through inter coolers is of the order of ~0.64 Gcal/ton of ammonia out of which ~0.46 Gcal/ton is through the synthesis compressor alone, i.e. ~72% of all interstage coolers. This loss, however, will not be eliminated unless the compression device is changed, but it can be thought of to recover this energy by process streams e.g. condensate stream before treatment as feed preheating. Nevertheless, the overall system does also require the cooling water, as during start-up these process streams will not be available.


Role of Catalyst
The performance of catalysts employed in the plant is the major factor towards overall energy efficiency of any process plant and should be considered as and when new high conversion efficiency catalysts come to the market. The catalyst activity is the property by virtue of which we have to play with bulk recycle streams; consequently, it leads to recurring expenditure on energy cost. If full replacement of any catalyst is not permitted then we should consider an optimum blend of high activity catalyst & cheaper catalyst. The higher energy cost today has completely changed the scenario of options, which were not supposed to be considered in the 1980's or 1990's.


Conclusion
Finally, it is the manufacturer who has to decide his limit of investment & limit of his returns. One should be careful in analyzing isolated options because one option combined with the other may be more useful & economical than both separately. Moreover, at times the effect of one option on the other may be negative as both of them serve in the same direction particularly when the plant is operating at its peak level of capacity. Hence, this is the right time for each manufacturer to look into his process again, for identifying potential energy savers using robust tools of energy audit.

Get Free Updates:
*Please click on the confirmation link sent in your Spam folder of Email*

Continue to read this post...